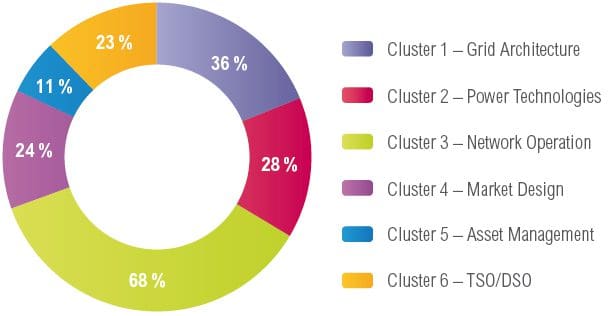
Fig.: a) Achievements per Cluster of ENTSO-E Roadmap 2013 – 2022;
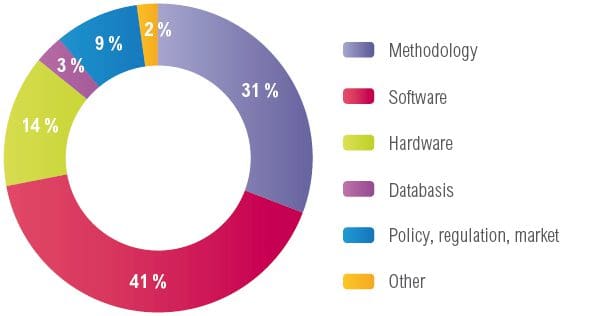
b) Achievements per category
It is therefore important to strengthen European coordination on R&I management and knowledge sharing to maximise synergies and avoid redundancies. Moreover, EU funding programs are not addressing the multiplicity of short-term, lower-profile challenges and innovation needs that TSOs experience in daily operation of the system. A set of inter-TSO projects and more knowledge-sharing activities are envisaged, outside EC funding schemes, to maximise synergies, best-practice adoption and, ultimately, customer satisfaction.
Only a few EU countries currently account for R&I expenses explicitly in their allowed costs. The R&I costs are considered as operational expenses, and therefore recovered through an ordinary tariff structure subject to efficiency mechanisms; hence the incentive to reduce them. However, EC legislation stipulates that national regulatory authorities are responsible for ensuring that TSOs and DSOs are incentivised to support R&I expenditures. This gap must be properly addressed at European-wide legislative and regulatory levels.
Another opinion claims that research institutes and universities are more suited to perform R&I in all fields including power systems, and TSOs should instead focus only on integrating third-party solutions into the grid. This approach neglects the natural TSO independence and non-competitive core mission, which allows them to act for the system’s best interest. Furthermore, TSOs are better equipped to setting R&I directions based on the needs stemming from their daily experience and early spotting of system macro-trends.
A proposal for a more enhanced and harmonised regulatory framework for R&I is presented in Appendix 4.

National / TSO Programmes
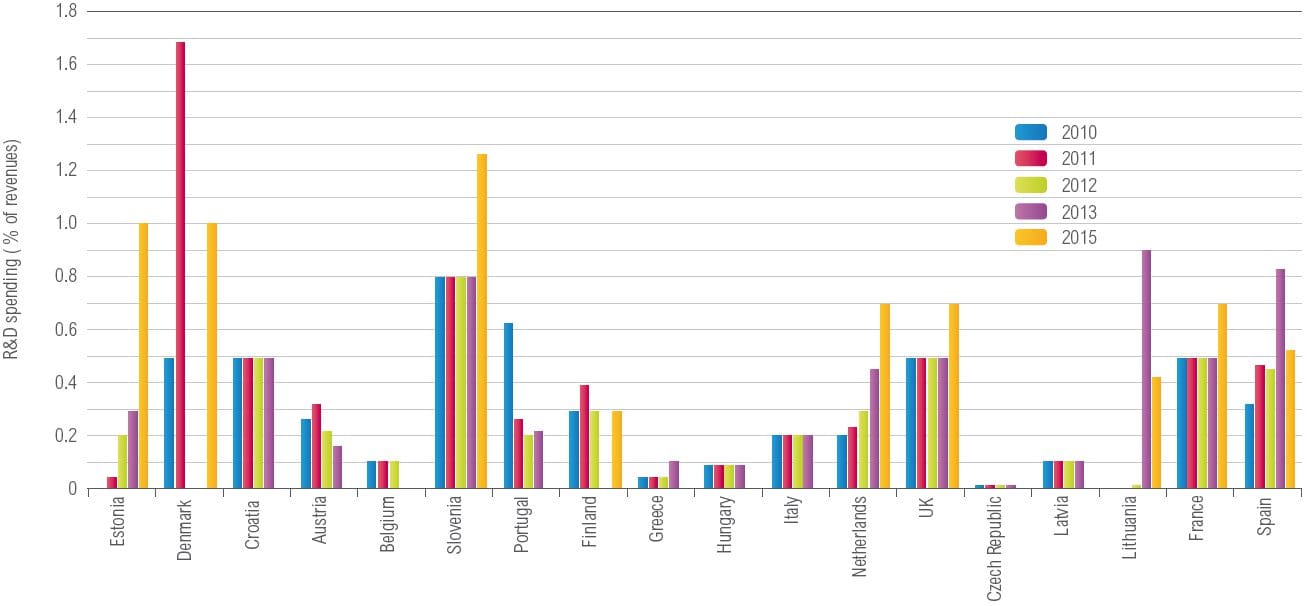
Fig.: R&I spending in percent of TSO revenue (For some countries the data has been updated for the year 2015 (yellow bar). For the rest of countries the R&D spending (% of revenues) refers to the year 2013. For Germany due to the existence of 4 TSOs, the country is not listed in the figure.)
National / TSO Programmes
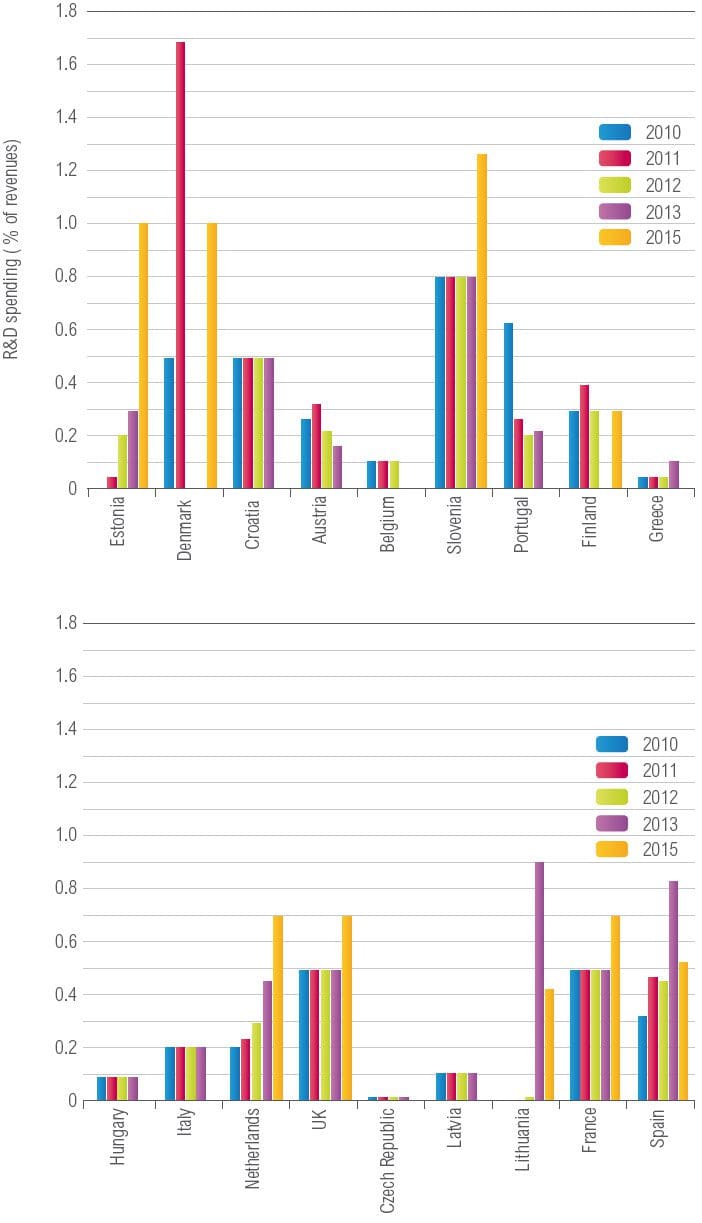
Fig.: R&I spending in percent of TSO revenue (For some countries the data has been updated for the year 2015 (yellow bar). For the rest of countries the R&D spending (% of revenues) refers to the year 2013. For Germany due to the existence of 4 TSOs, the country is not listed in the figure.)